Saturday, 30 November 2024

Innovative Partner Matching with Python, Neo4j, and LangChain


Hello everyone! imagine finding your ideal partner based on a simple description! This blog post explores the creation of a personalized partner search engine using Python, Neo4j, and LangChain, inspired by a project. Let's delve into how this innovative system can streamline your search for love (or friendship!).


High-Level Design


The system operates through a well-defined architecture:

  1. Data Generation: We create a diverse dataset of potential partners using Faker, a Python library for generating realistic fake data. This allows us to populate a Neo4j database with a rich pool of individuals.
  2. Data Storage: The generated data, including names, locations, hobbies, and values, is loaded into a Neo4j database. Neo4j excels in handling relationships between data points, making it an ideal choice for our matchmaking system.
  3. User Interface: Streamlit, a user-friendly Python framework, provides a web-based interface where users can describe their ideal partner.
  4. User Input Processing: The system analyzes the user's description to extract key criteria like hobbies, preferred age range, and even desired values (e.g., "family-oriented").
  5. Database Query: Based on the extracted criteria, the system queries the Neo4j database to find potential matches.
  6. Result Retrieval: Matching profiles are retrieved from the database.
  7. Results Display: The user interface showcases the profiles of potential partners who align with the user's description.


Code Implementation

The blog post  provides a detailed breakdown of the code for each stage. 


Here's a glimpse into the key components:

  • Data Generation: Faker helps us create a diverse set of profiles with attributes like names, ages, locations, hobbies, preferred values, and even gender preferences.
  • Data Loading into Neo4j: The generated data is then transformed into a format suitable for Neo4j and loaded into the database.
  • Streamlit UI and LangChain Integration: Streamlit powers the user interface where users can enter their ideal partner description. Additionally, LangChain, a natural language processing framework, could potentially be integrated to further refine the criteria extraction process.


Demo: How It Works

  1. Data Generation: A dataset of potential partners is created and loaded into the Neo4j database.
  2. User Interaction: You access the Streamlit app and describe your ideal partner. For example, you might say, "I'm looking for someone between 28 and 35 who enjoys traveling and is ambitious."
  3. Search and Results: The system queries the database based on your description. Matching profiles with compatible hobbies, age ranges, and values are displayed.


Conclusion: Beyond the Basics

The core functionality of this partner search engine paves the way for exciting possibilities:

  • Advanced Language Processing: Integrating sophisticated language models can improve the accuracy of criteria extraction from user descriptions.
  • Real-time Updates: Continuously updating the database with new profiles and preferences ensures a dynamic and ever-evolving pool of potential partners.
  • Privacy and Security: Robust security measures are crucial to protect user data and ensure the system's ethical implementation.

The Future of Partner Search

By combining these technologies, we can create a valuable tool that empowers individuals to find compatible connections. As the system evolves, addressing ethical considerations and potential biases remains paramount. Ultimately, this partner search engine has the potential to revolutionize the way we connect and build meaningful relationships.


Monday, 18 November 2024

All About BigQuery


Hello data lover!  today’s data-driven world, organizations generate vast amounts of data from various sources—websites, IoT devices, customer interactions, and more. To make sense of this data and use it for better decisions, businesses rely on data warehousing. In this article, we will discuss one of the data warehousing services provided by Google Cloud Platform: BigQuery.


BigQuery is a fully managed, serverless, cloud-based data warehouse provided by Google Cloud. It is designed for fast SQL-based analytics on massive datasets. BigQuery is known for its scalability, integration with Google Cloud services, and ability to handle large-scale analytics efficiently without requiring significant infrastructure management.

Use BigQuery when:

  • You need to run fast SQL queries on large datasets (petabytes).
  • It's for analytics, reporting, or business intelligence.
  • You prefer a serverless, fully managed service with automatic scaling.
  • You need real-time analytics with streaming data.

Avoid BigQuery when:

  • You need frequent data updates or inserts (use Cloud SQL or Firestore).
  • For small-scale, transactional, or unstructured data (use Cloud Storage or Cloud SQL).


Let’s explore the internal architecture of BigQuery and understand how it works. Refer to the diagram below as we discuss each component step by step.


Brog:

Google's Borg system is a cluster manager that runs hundreds of thousands of jobs, from many thousands of different applications, across a number of clusters each with up to tens of thousands of machines.

Dremel:

BigQuery takes advantage of Borg for data processing. Borg simultaneously runs thousands of Dremel jobs across one or more clusters made up of tens of thousands of machines. In addition to assigning compute capacity for Dremel jobs, Borg handles fault-tolerance.

Jupiter Network:

Big data workloads often face bottlenecks due to network speed, not just disk I/O. Since BigQuery separates its compute and storage layers, it depends on a lightning-fast network to move massive amounts of data—terabytes within seconds—from storage to compute for executing Dremel queries. This is made possible by Google’s Jupiter network, which provides BigQuery with an impressive 1 Petabit per second of total bisection bandwidth, ensuring seamless data transfer and high performance.

Colossus File-System:

BigQuery leverages Capacitor to store data in Colossus. Colossus is Google’s latest generation distributed file system and successor to GFS (Google File Systems). Colossus handles cluster-wide replication, recovery and distributed management. It provides client-driven replication and encoding. When writing data to Colossus, BigQuery makes some decision about initial sharding strategy which evolves based on the query and access patterns. Once data is written, to enable the highest availability BigQuery initiates geo-replication of data across different data centers.

Client for BQ:

There are multiple ways to retrieve/anaysis which are stored in BQ.

BQ Console/ Web UI:

From BQ console, we can directly execute the query and we can see the result based on query statement. BigQuery supports almost all SQL syntax, but some data types and functions differ from other relational query languages. Please refer to the UI console snapshot and the table creation example below.


Note: 

Web UI has many features like data preview, schema preview, table details, data Lineage etc.

Example:


Executing from Command-line:


Below I have described all options in detail:

·       bq mk --table: Command to create a table.

·       description: Optional. Adds a description to the table.

·       label: Optional. Adds labels (key-value pairs) for easier resource management.

·       project_id:dataset_id.table_name: Specifies the project ID, dataset ID, and table name. Replace these with your actual values.

·       schema.json: Points to a JSON file defining the table schema.


Interact with BQ using Python:


Note:

BigQuery can Integration with GCP services:

  1. Google Cloud Storage (GCS): Load large datasets from GCS into BigQuery.
  2. Google Cloud Pub/Sub: Stream real-time data into BigQuery.
  3. Google Cloud Dataflow: Process data before loading it into BigQuery.
  4. Google Cloud Dataproc: Use Spark/Hadoop for large-scale processing and load results into BigQuery.
  5. Google Cloud AI/ML: Integrate machine learning models with BigQuery for predictions and analysis.
  6. Google Cloud Functions: Trigger actions in BigQuery based on events.
  7. Google Cloud Spanner: Analyze transactional data from Spanner in BigQuery.
  8. Google Cloud Bigtable: Query time-series data from Bigtable in BigQuery.
  9. Google Cloud Firestore: Export and analyze Firestore data in BigQuery.
  10. Google Cloud Logging: Export logs to BigQuery for analysis.
  11. Google Cloud Data Catalog: Organize and discover BigQuery datasets.
  12. Google Cloud Composer: Automate ETL workflows involving BigQuery.
  13. Google Cloud Pub/Sub (Streaming): Stream IoT data into BigQuery for real-time analytics.

Q. How many types of tables you can create in BigQuery?

1.      Native Tables: Standard tables for storing structured data directly in BigQuery.

2.      External Tables: Reference data stored outside of BigQuery, like in Google Cloud Storage.

3.      Partitioned Tables: Split by a field (e.g., date) for efficient querying of large datasets.


Notes:

·       Only DATE, TIMESTAMP, or INTEGER columns can be used for partitioning.

·       Partition Size: Each partition in a partitioned table can have up to 1 TB of data.

·       Partitioned Tables by Date/Integer: The maximum number of partitions allowed per table is 4,000.

·       Null Values: Null values are not allowed in partitioning columns.


4.      Clustered Tables: Sorted by one or more columns to optimize query performance.

5.      Temporary Tables: Short-lived tables used for intermediate query results.

Q. How many types of views you can create in BigQuery?

1.      Standard View: A virtual table based on a SQL query, with no data stored.


Example: CREATE VIEW project_id.dataset_id.view_name AS

SELECT column1, column2 FROM dataset.table WHERE conditions;

2.      Materialized View: A stored version of a query result, automatically updated for faster performance.

Example: CREATE MATERIALIZED VIEW project_id.dataset_id.materialized_view_name AS

SELECT column1, column2 FROM dataset.table WHERE conditions;

3.      Authorized Views:

Authorized Views in BigQuery allow you to provide users access to a view that references sensitive or restricted data, without directly granting access to the underlying tables or datasets.

Example:

# Granting the authorized view access to the underlying dataset (dataset1)

bq add-iam-policy-binding project1:dataset1 \

  --member="user:example@domain.com" --role="roles/bigquery.dataViewer"

-- Querying the authorized view in dataset2

SELECT * FROM `project1.dataset2.view_name`;


Friday, 28 April 2023

Spark internals


Spark is a distributed data processing engine and every spark application itself is distributed data processing engine. Spark need a cluster along with a resource manager to perform distributed computation. As of now, Spark supports the below cluster technologies.

·       Standalone

·       YARN

·       Kubernetes

·       Mesos

       But in this article, we are assuming that we have a YARN resource manager to manage the spark cluster. Below is the high-level architecture of the spark cluster.


Let’s try to understand how Spark works internally. This is an important concept which helps us in every aspect when you dealing with large amounts of data. I will try to make it very simple.


Firstly, we need to know how can we execute the Spark application, there are two ways to run the Spark application

1)      Interactive mode

2)      Batch mode

 Interactive mode, generally we do for testing purposes because we need immediate output after each instruction. We can do this by using spark-shell or Jupyter Notebook.

Batch mode, we perform in production when the spark application is fully completed. It executes completely and generates the final output as per business requirements. We can do this by using the spark-submit command.

Now let’s come to the above diagram, here you can see that programmer doing the spark submit. Spark is written in Scala (Scala is a JVM language) which means Spark's native language is Scala.

Let’s suppose I want to execute the Pyspark application then we have to use spark-submit command on the terminal. Then our request will be submitted to the resource manager then YARN RM  randomly select a worker node and creates one Application Master(AM) container and start the main method in the AM container. Again here raised one more question what is a container? Container is an isolated virtual run-time environment. Here is a question if Spark is written in Scala, then How Spark can execute other languages like Python, Java & R?

Let’s come inside the Application master container. AM Container is responsible to execute the main method of application but here we have a Python application that’s a Pyspark application. In the case of the Pyspark application, AM container consists Pyspark driver & JVM driver. When we submit the Pyspark application the Pyspark driver executes the main method of the Pyspark application because Pysaprk is designed to execute the main () of the Pysaprk application. Then Pyspark starts the JVM main method with the help of Py4j.

Refer to the below two diagrams for better visualization.


Once JVM main method started executing the AM request to the YARN resource manager for executors.

Then creates executors as per configuration and returns all details of executors to the AM.


In conclusion, Spark helps us break down intensive and high-computational jobs into smaller, more concise tasks which are then executed by the worker nodes. It also achieves the processing of real-time or archived data using its basic architecture.


Tuesday, 14 February 2023

Demonstrating spark project on Docker

Hello everyone! In this article, we will discuss about few ecosystems which are widely used in big data domain. All stacks I have designed over docker contains and also I will give you little a bit basic understanding about the docker.

Let’s start with high level project understanding……


Here we have created four ecosystems on docker containers which are given below:

1)      Apache Airflow: This is used for orchestrating and scheduling the jobs.

2)      LIVY: We are using this to submit the spark job.

3)      Apache Spark: This is using for doing some data processing (Aggregations & manipulating the records) as per the business requirements.

4)      MySQL: This is our destination. This might be different, could be object storage (s3, gcs etc.), RDMS(oracle, mysql, postgres etc) or local filesystem as per your use case.


Let’s set-up the environments on docker containers. Firstly we are going to create environment for the Apache Airflow using docker-compose.yaml.


Copy the above code snippet and store in a docker-compose file and execute the below command on terminal or cmd.


Once Airflow services started in different containers then try to access the airflow webserver in web browser. In my case I am running docker in local and defined 9099 port for airflow webserver.


http://localhost:9099

default User: airflow

default password: airflow


Perfect! We have successfully built Apache Airflow setup on docker container. Now let’s jump on Spark and Livy setup.

Below is yaml file  snippet for creating Apache Spark and Apache Livy containers. We need to execute yaml file using command.


we have successfully built spark and Livy setup also. Now we need to test the environments, for that we are going to do the spark submit using Livy and also we will schedule the spark submit job from Apache airflow to Apache Livy and code will execute on spark worker nodes and writing the outcome to mysql database.

Copy the pysaprk code from local to Livy machine to path using below command.


Now login to airflow webserver node and create a DAG python file into dags directory.

It will look like below snapshot and we are good to trigger the job.


That’s it …. we have validated all the integration, further we are able to build the spark code as per business requirement and for the automation we have to follow same procedure.

Tuesday, 21 September 2021

Demonstration Of Catalyst Optimizer


Hello Everyone! In this post, we will discuss about one of the advance topic in the Spark and it is very confusing concept for the spark beginners and recently people has started to ask questions based on this this topic and they want to understand that what is your knowledge about how spark internally handles your spark SQL and how spark internally handle your commands, whatever you have written as part of spark code.  So generally, they start with this question like what is catalyst optimizer.

In this article, initially I will try to understand you about Catalyst Optimizer through theory, later I will give you demonstration about this concept.

Let us start …


What happens if you are not a very experienced developer and your code will not be optimized and it will not give you very good results but if you use dataframe and dataset it gives you far better performance because SPARK internally takes care of optimizing your code so optimizing your code and creating RDD execution plan which will run fast.

Catalyst optimizer is a component in spark, which is used for this optimization your input can be coming from spark SQL, dataframe, dataset or some other things.  When submit your code to spark it builds query plan. It uses catalyst optimizer to create optimized query plan and then optimized query plan is used to generate a RDD code.


Now I am going to discuss all the above phases in details. Let us discuss each phase one by one.

1)     Unresolved Logical Plan:

In this phase, we submit Spark SQL query as an input. Let us suppose if we are using dataframe or spark SQL and then we submit a query to spark in form of unresolved logical plan.

2)     Logical Plan:

In this phase, firstly spark analyzes syntax, columns so on then it convert the spark query in the form of a tree.  Spark operations we have defined on RDD it converts those chain SQL operations into a tree and as you know first leaf nodes are regulated and then the parent nodes.

3)     Optimized Logical Plan:

In this phase, spark gets SQL query in the form of tree after that spark execute whole tree until it consumes the whole tree nodes.  In this phase we start with the logical plan tree so spark catalyst optimizer always talks in terms of trees so it applies transformation on a tree and generates a new tree so in the end of multiple transformations, we will get most optimized tree.

4)     Physical Plans:

In this phase, Spark check what kind of Joins or filter or aggregation operations you have applied on data.  After that spark, evaluate the cost and used resources by all the operations.

5)     Select Physical Plan:

In this phase, Spark select only cost and resource effective operations and the physical plan convert into RDD code then finally executed by Spark.

Let us demonstrated each phase:

Explain ():

Specifies the expected output format of plans.

  • Simple: Print only a physical plan.


  • Extended: Print both logical and physical plans.


  • codegen: Print a physical plan and generated codes if they are available.


  • cost: Print a logical plan and statistics if they are available.
  • formatted: Split explain output into two sections: a physical plan outline and node details.


Saturday, 15 May 2021

ETL Pipeline Orchestration on Apache Airflow


Hello Everyone! Today we will discussion about the one of most important and interesting activity which is play a vital role in data engineering area. If you are data engineer or you sit around data lover then you must heard about ETL terminology. If you did not hear then no need to worries about. In this article, we are going to discuss about it in detail.


Before knowing about the ETL process, we need to know why this activity became as necessity these days? And after ETL, what we can achieve? As we know that there are multiple applications we have and every application generating or consume the data but it does not necessary every application will provide you data as per your required format so in this case you have to put some extra effort to convert the data as per your desire.


ETL refers to Extraction, Transform and Load. ETL operations are often performed by fit-for-purpose tools that have been on the market for a long time, and sometimes by custom in-house programs.


  • Extracts data from homogeneous or heterogeneous data sources.

  • Transforms the data for storing it in proper format or structure for querying and analysis purpose.

  • Load it into the final target (database, more specifically, operational data store, data mart, or data warehouse)

Let’s discuss about Big data platform.


Here I am using three nodes of CentOS cluster and I deployed Hadoop with Apache Spark, Apache Hive, Apache Airflow and Jupyter Notebook.


As you can see in ETL high level architecture there are four phases; source, staging, transform and publish. Let discuss about these four phases.


1) Source: In this phase, we have flat files and this file we can get from any applications but in my case this is available on my local Linux machine and we are going to copy to table hdfs location.


2) Staging(RAW Layer database): In this phase, we are going to create table in hive and defining all columns data types as String.


3) Transform(Transform Layer database): In this phase, we are going to transform the data types of raw layer table as data dictionary. Data dictionary is defined by business so we need to transform the data types of table’s columns as data dictionary.


4) Publish: This is final database layer which will be available for the analyzing purposes.


All the above phase, we will create the workflow on Apache Airflow.


Below is the Apache airflow DAG code


Step 1: create table in raw database.


Step 2: transfer the datasets into the hdfs raw databases table directory. you can get the code for this step in airflow etl.py file.


Step 3: create table into transform database as per data dictionary.


Step 4: pull the from raw database, type cast as per data dictionary and insert into transform database.


Step 5: create table into publish layer database.


Step 6: Insert all records from transform layer database to Publish layer database.


Data Validation:


Raw Layer:


Transform Layer:


Publish Layer:


Finally we have successfully completed the fully automated ETL activity :) .


Wednesday, 12 May 2021

Operations on Dataframe


Hello Everyone! In this post, I will be demonstrate some operations which are very important to know when you are dealing with Dataframe. 


As we get data from different sources in different form of data like Structured, semi-Structured and Unstructured and we need to be sure about data quality before visualization. It might change to get inconsistent, incomplete, ambiguous and duplicate data and we can’t get meaningful information from the raw data so in this case we need to use the some operations to manipulate the data.


Here I will load datasets into Dataframe and apply some operations on it.

So let’s start ….

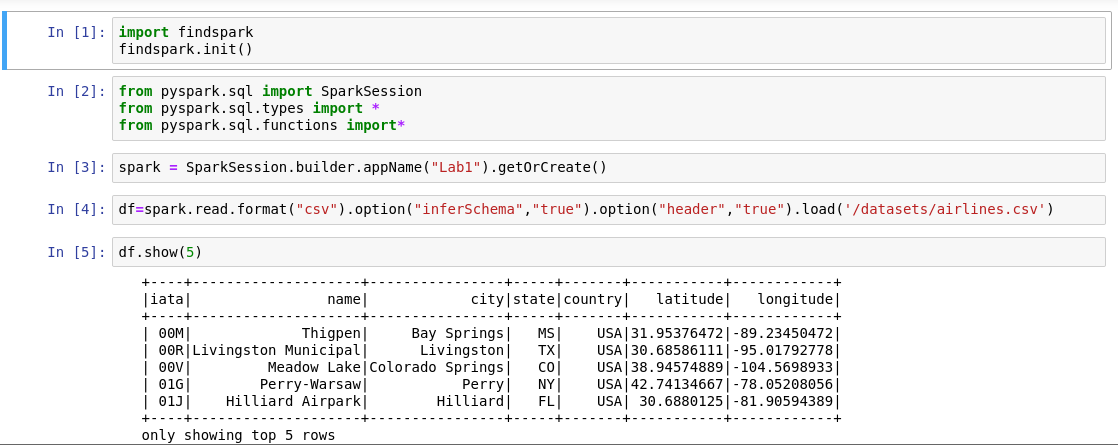
Before performing the operations on Dataframe we need to bring the data into Dataframe.

I am going to create spark session and after i will load data into DataFrame


1) How to project columns?


There are three ways to project the columns from Dataframe.

1st Method:


2nd Method:

3rd Method:


2) How we can retrieve the desire records from the Datafram?

There are two methods filter(condition) and b) where(condition) through these method we can project only those records which are satisfying the conditions.

For example:

In the below example i am using where with some conditions.


In the below example, i am using filter method with some conditions.


3) How we can merge two columns into single column?

For this activity, i am going to load student datasets into new datframe df2. In this dataframe we can see that for student name we have two separate two coulmns; first_name and last_name. Now i am going to merge into single.

Here i am using concatenate method to merge  the columns.


4) How we can rename the column in dataframe?

Let's suppose, we have an datasets having columns name in not proper manner. there are two options to define the schema

 i) we can infer the schema from datasets and rename the column name as per you requirement but infer schema is not recommended for large datasets.

Let see the below example, how we can rename the column.

 Before renaming the dataframe column:


 After renaming the dataframe column:


ii) Define the schema and pass schema to dataframe when you are creating dataframe.

For example: